Reaction Plan Manager++ Shop Floor View
Reaction Plan View
Choosing a process (button) from the Process
Status dashboard displays the Reaction Plan
View. Tools are provided to show a history
of Reaction Plan events, retrieve reports
and perform data analytics for a process.
The event history is displayed as a list
arranged by time with the latest on top.
Each event is easy to identify by date, location,
part ID and severity. You pick the start time,
end time and location to filter the events.
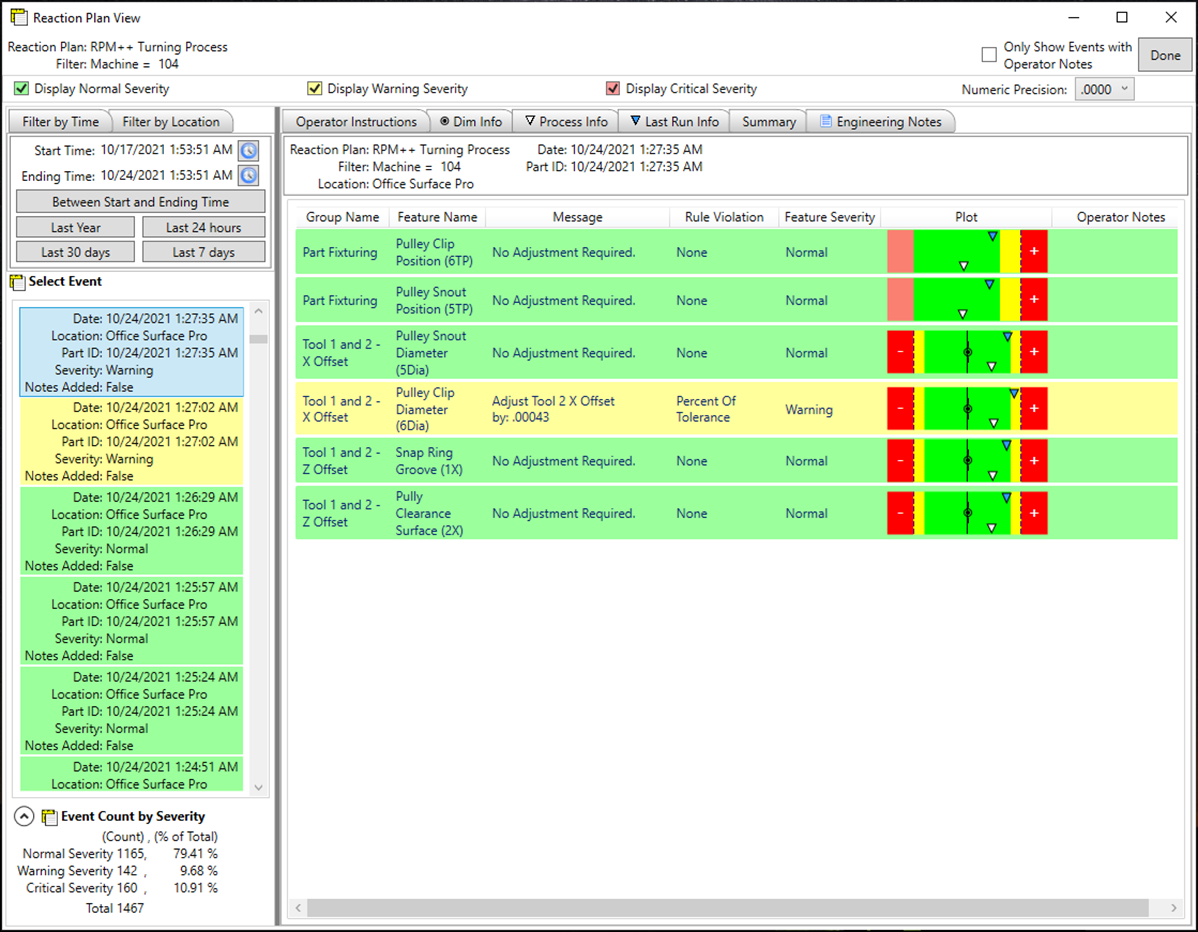
Event Information (RPM++ Report)
Click on the event from the list to
retrieve the information displayed to
the operator at that date and time.
The information includes the operator
instructions, dimension information,
process information and last run
information.
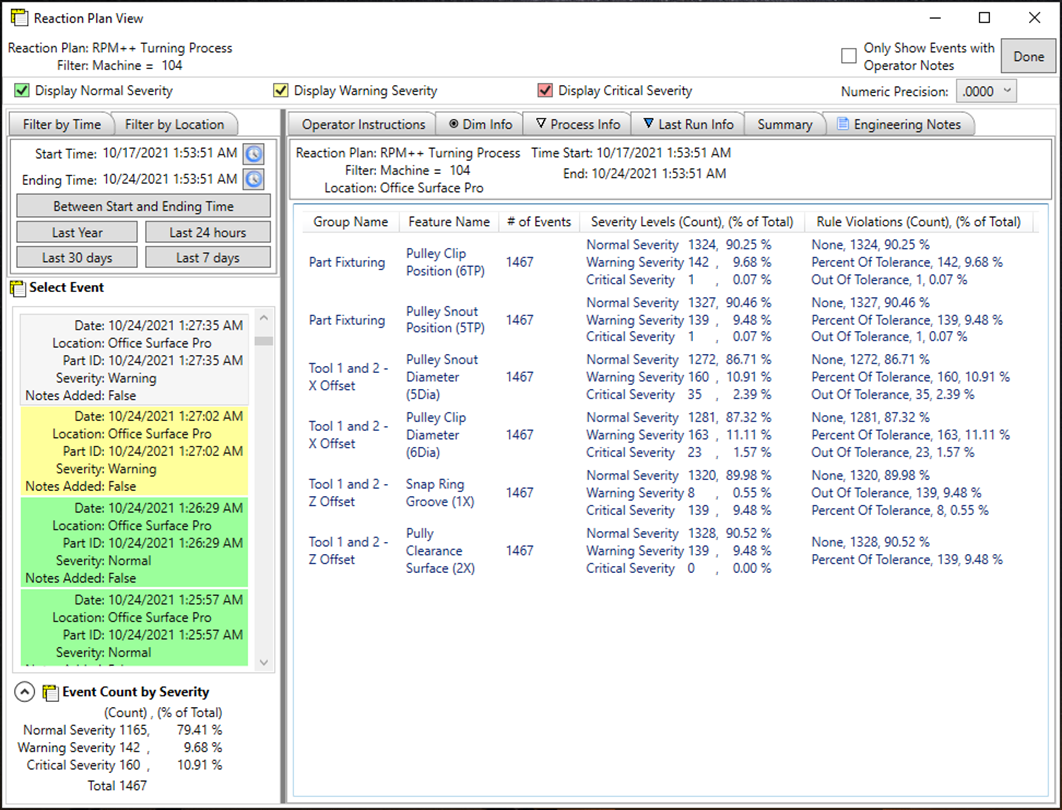
Data Analytics
Provides an RPM++ event count for a process
over a duration of time grouped by severity.
A manager can utilize this information to
determine if operators are measuring their
parts and adjusting the process per the
instructions for a machine during a shift.
Data analytics are also available at the
feature level (Summary tab). A severity
level and rule violation count are
calculated by feature over a duration of
time. Using this information an engineer
can easily determine which features failed
to meet the process control criteria.